GALLERY OF KNOWTABLE THINGS
The power of graphics as an analysis and communication tool became obvious to me as a landscape architecture student at the University of Illinois. Graphics’ potential stayed with me as I moved into my second career, instructional design. Not every project calls for graphic analysis or presentation, and visuals can be distracting if not used appropriately. That said, I’ve found that communication is usually clearer and solutions are stronger when visuals are incorporated as part of the process or as the solution.
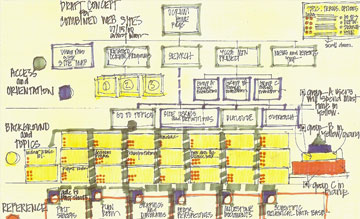
PROJECT CONCEPTS
My first move on most projects is to put magic marker to newsprint pad and sketch pieces and relationships: What pieces of this puzzle do I know about? What seem to be the relationships? Where do I see gaps—where aren’t the pieces connecting? The boxes, arrows, bullets and circles start working across the page. Lists evolve. I might visualize an end product of some kind: a course plan, an outline, a website, a tool. The 30-45 minutes I spend doing this is usually the most creative part of the project. I try not to become too attached to my earliest ideas. (Hard sometimes!)
WAYFINDING
I worked with logistics and published quick plans, schedules and updates on the construction site of one of the world’s largest hotels. On any given day, hundreds or even thousands of workers—some portion of them first time and one time only visitors—navigated their way into and through spaces under construction. Walls and access points appeared, moved, and disappeared regularly.
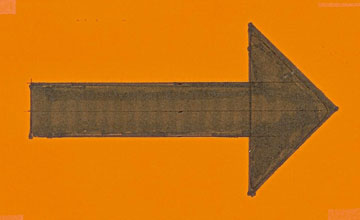
My just-in-time “breadcrumb” wayfinding system was simple, flexible, highly visible (bright orange), inexpensive—and it worked!
The system: 150 18” X 24” plexboard arrows taped to walls and doors at key locations where workmen could easily take the wrong turn or go through the wrong door. As needed, signs were hung or re-hung pointing to the right, to the left, up or down.
This temporary information system saved frustration and time—a few minutes here and there, hundreds of times per day. It enhanced safety and kept people out of places they weren’t supposed to be.
TRAINING-THE-TRAINER WITH STORYBOARDING
The Managing Directors in the Tupperware Europe organization were not professional trainers but were frequently called upon to lead just-in-time, on-the-spot training workshops as they visited cities in their respective countries.
I created a series of symbols to represent interchangeable learning components: gain learners’ attention, present content, share examples, ask questions, run practices and use debriefs. I printed the symbols on index cards (one symbol per card) and assembled sets of cards for each trainer. As part of the train-the-trainer, we storyboarded short presentations on sales and product topics. As the directors added their own notes, the cards evolved into presentation tools.
In subsequent train-the-trainer programs that I’ve delivered, I use the symbols and cards to help participants understand the structure of training and demonstrate how key components can be flexibly arranged to keep programs interesting and organized.
FLOOR PLAN SPACE ANALYSIS
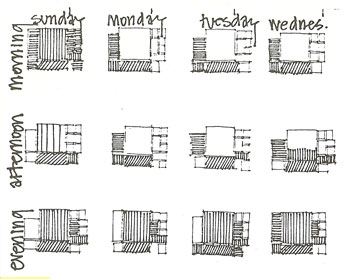
Architects and engineers use graphics as analysis tools. As a landscape architect, I once participated in a feasibility study for a small science museum. One candidate for the center’s venue was a well-located, contemporary local church with a 950-seat auditorium, abundant parking, a lobby area and classrooms.
Graphically, the church floor plan is represented in layouts of rectangles. When church activities were coded and mapped by (1) time of day and (2) day of the week, the analysis demonstrated the time periods during the week that science center visitors would not impede church activities. In this instance, a one page graphic was far more compact and readable than a text or verbal summary, and made a strong case.
MODEL BUILDING
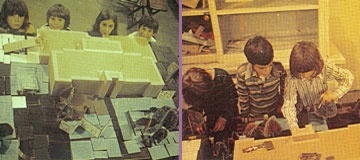
Way back—way, way back as a landscape architecture student, I took on a project for the PTA of a local elementary school. My assignment: Design a playground for the asphalted school yard. I agreed with one condition; that I would teach landscape architecture to a class of fourth graders and use their ideas for the playground in the design. One team of young landscape architects is pictured here, working with a model of the building and moveable components that the students decorated as trees, shrubs, paving materials and equipment. Now my young designer friends very likely have fourth graders of their own.
WEBSITE REDESIGN
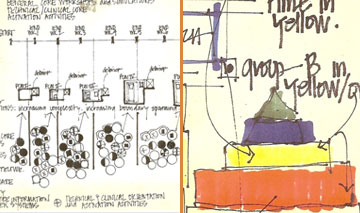
This graphic accompanied the report component of my web site analysis for the Yucca Mountain project, the Department of Energy’s proposed nuclear waste disposal site northwest of Las Vegas. I reviewed the current websites, provided feedback to site developers and created new web site concept maps, including this one.
Color coding communicated the website zones that different visitor audiences would likely visit. Clearly defining different audiences for the site—ranging from the general public, to school teachers to high level scientists—was a step forward for site managers and drove the site design. The graphic concepts demonstrated the potential for one site to serve multiple publics and enable any given visitor to “go deep” –or not—as appropriate to their need.
CURRICULUM MAPS
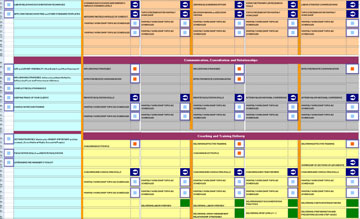
For Intrepid Learning Solutions clients, I assembled analysis maps in Excel that sequenced five to six worksheets into a curriculum “workbook.” Collectively, the worksheets presented a picture of potential and actual learning resources related to specific job roles. Usually, the curriculum map accompanied a written report.
-
Within the typical curriculum map workbook, the analysis sheets display:
- Task priorities and required skills
- Existing and proposed learning resources
- Resources mapped to task priorities
- Implementation plans
Graphics took the form of color coding, symbols and locational headers to organize and highlight text information. Map users and decision makers are able to find and focus on information relevant to their specific questions, and change/update the maps as needed.